Dla wielu użytkowników będzie z pewnością istotny także aspekt ekologiczności. Z uwagi na fakt, że tusze latexowe oparte są na bazie wody nie istnieje niebezpieczeństwo pojawiania się nieprzyjemnych zapachów, które mogą być szkodliwe podczas pracy maszyn. Zamknięty obieg termicznego utrwalania i suszenia sprawia, że wykorzystanie gotowych wydruków może być natychmiastowe.
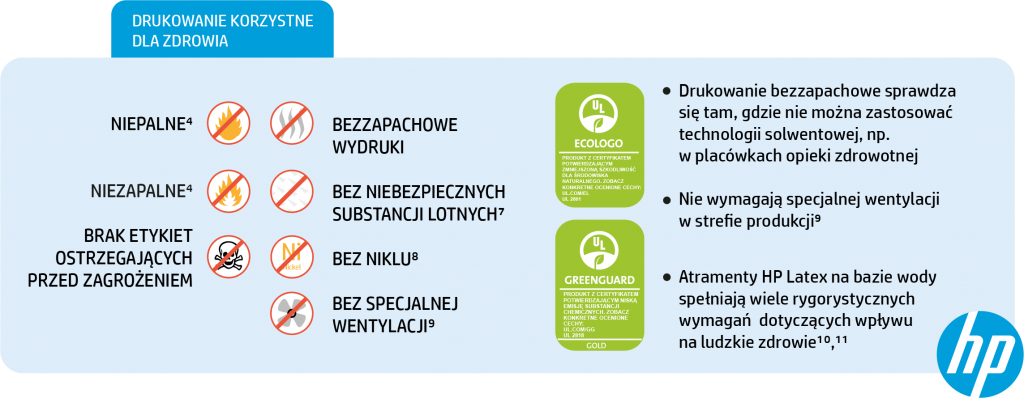
Druk zgodny z rygorystycznymi europejskimi normami dla reklamy in- i outdoorowej. Ekologiczność tuszy została potwierdzona certyfikatami UL ECOLOGO i UL GREENGUARD GOLD, a wydruki spełniają normy AgBB.
Dzięki technologii druku HP Latex możliwe stało się stworzenie proekologicznych produktów końcowych coraz częściej wymaganych przez klientów. Technologia gwarantuje wydruki najwyższej jakości, które bez względu na czas są bezwonne i nietoksyczne.
Druk HP Latex jest bezpieczny dla użytkowników aplikacji oraz operatorów urządzeń. Nie ma negatywnego wpływu na środowisko. Podczas drukowania nie uwalniają się żadne toksyczne substancje, które mogłyby stanowić zagrożenie dla życia lub zdrowia.
Urządzenia HP Latex posiadają certyfikat ENERGY STAR, co oznacza, że spełniają surowe wytyczne w zakresie energooszczędności

Japanese candlesticks pattern Bullish & ..
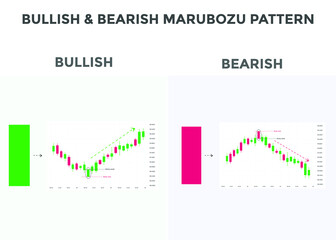
Bullish and bearish marubozu candlestick..

Bullish and bearish marubozu candlestick..
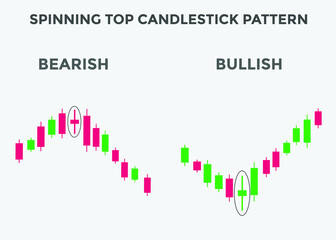
Spinning top candlestick pattern. Spinni..
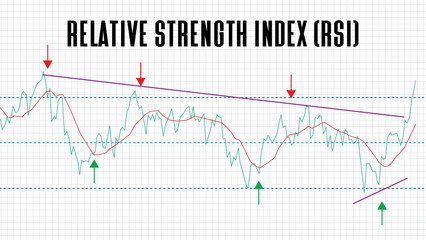
abstract background of relative strength..
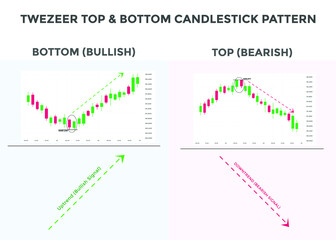
Tweezer top and bottom candlestick chart..

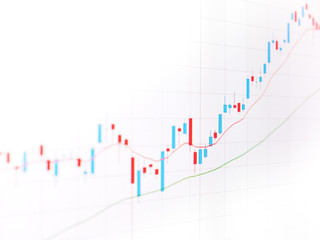
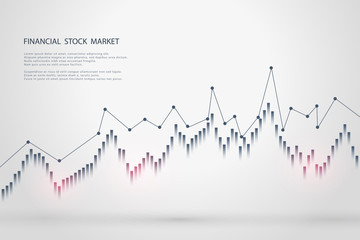
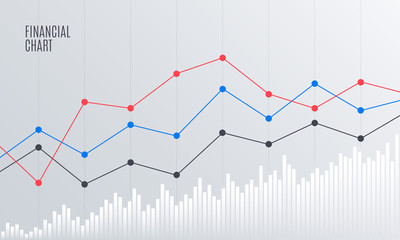
Abstract business and financial graph. S..
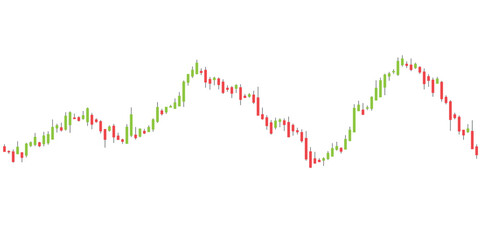
Candle stick graph chart of stock market..
piercing pattern candlestick chart patte..

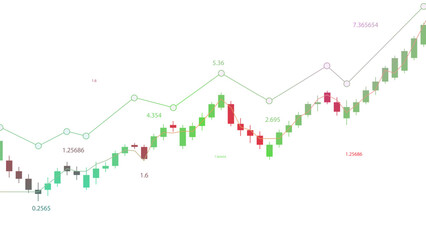
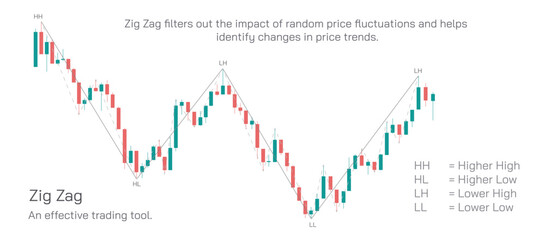
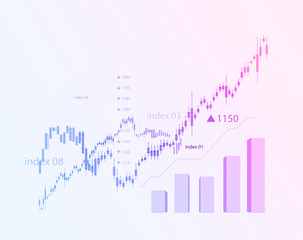
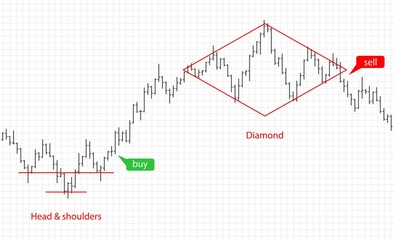
Stock market Investing and trading strat..
Stock exchange vector chart - candlestic..
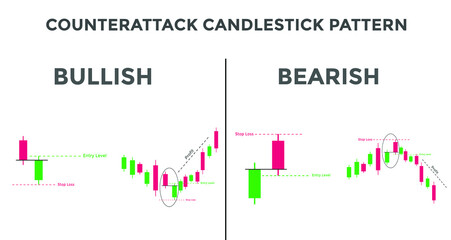
Counterattack candlestick chart pattern...
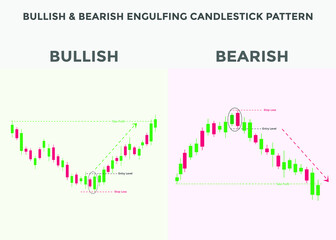
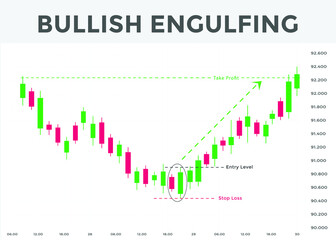
Japanese candlesticks pattern Bullish en..
Stock market graph or forex trading char..
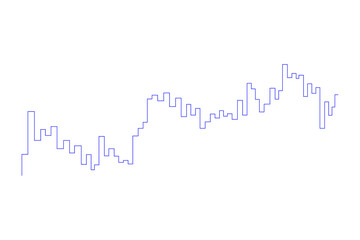
The schedule for changing the stock mark..
Bullish marubozu candlestick chart patte..

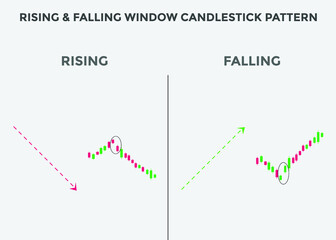
rising & falling candlestick pattern. ri..
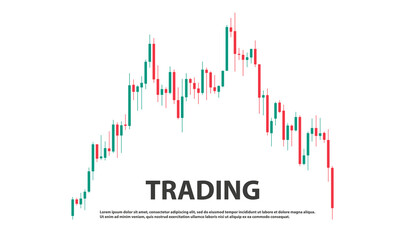
Trading Strategy Background. Vector Illu..
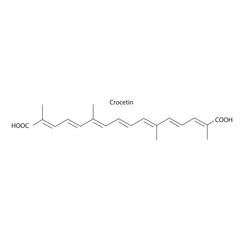
Crocetin skeletal structure diagram.Cara..
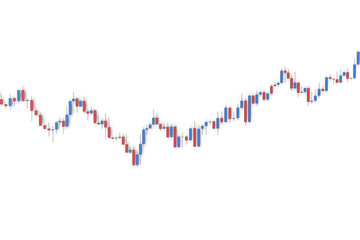
Stock market chart with shadows isolated..
Bar financial data graph. Forex stock cr..
Digitally generated image of blue line g..
Abstract Financial Chart with Line graph..
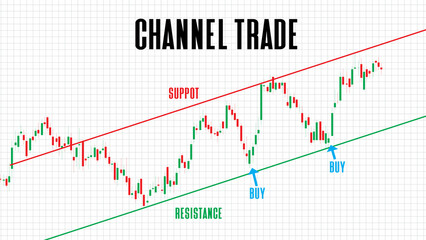
abstract background of channel trade sto..
Infographic design elements for your bus..
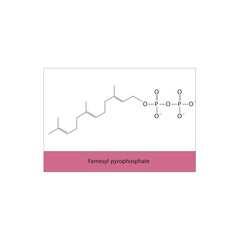
Farnesyl pyrophosphate..
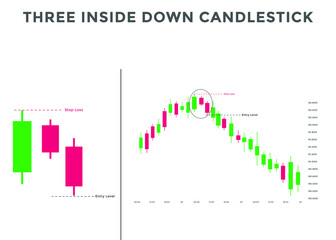
Three inside down candlestick chart patt..
Stock market Investing and trading strat..
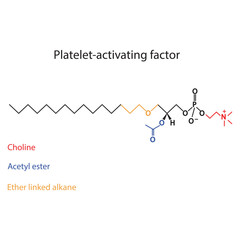
Structure of PAF (Platelet activating fa..
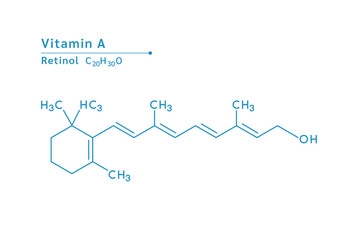
Vitamin A structural blue outline chemic..
Tweezer top and bottom candlestick chart..
Abstract Business chart with uptrend lin..
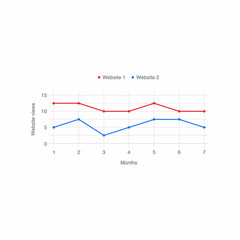
Vector Line Chart Table for Business Res..
Abstract financial chart with uptrend li..

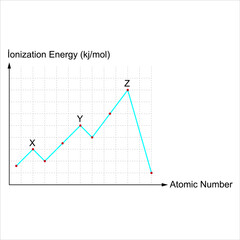
Atomic number ionization energy change ..
Pixel rainbow cardiogram with heart. Col..